Here is a description of your company. Proin ex id consectetur lobortis. Aliquam, velit vel faucibus dapibus, augue justo ullamcorper turpis, nec convallis metus nunc vel turpis.

Data Analysis for Non Programmers
A course specially designed for beginners trying to get into analytics with little knowledge in coding.
Hello,
I am Ashish, founder of DoingData. I have designed a course which fits needs of beginners trying to break into data analysis.
The course starts with foundational skill of MySQL and moves on to Tableau Desktop for exploring and visualizing data. Over the time, students build skills in information design, and business analysis using various analysis techniques and weekly projects.
If you are curious about the course, you can schedule a 20 minutes free consultation with me to discuss if this course aligns with your career goals and you are fit to become part of the next cohort.
Cheers, and keep learning 📈

4 Pillars of Data Analyst
Think Like An Analyst
When you think like an 🕵️♂️ analyst, those abstract numbers start talking to you. It makes journey of your analysis from what to why easier.
Build Like A Developer
Ship a dashboard that is engineered well. It takes a real developer 👨💻 to build a product that stands test of continuously changing data.
Visualize Like A Designer
Make it beautiful & functional. Make it a breeze 🙂 for your user to use consume the analysis or navigate the dashboard.
Communicate Like A Storyteller
The information should tell a story, provoke your user to take a necessary action 💡 and should hit where it needs to.
Course Curriculum
Phase I Taking Baby Steps (Week 1 to Week 3)
MySQL for Beginners
Get started with Tableau Desktop
Build Your First Tableau Dashboard
Connect with Tableau Community
MakeOverMonday
Publish your work online
Phase II Beginner Tableau Skills (Week 4 to Week 6)
Tableau Desktop Foundations
Visual Vocabulary
Chart Usage Guide
WorkoutWednesday
Portfolio Building
Project Work
Phase III Producing Serious Results (Week 7 to Week 12)
8 Data Analysis Techniques
KPI Analysis
Reporting
Complex Projects
Success, Friendships & Next Steps
How the course will be delivered?
The Schedule
Starting from August 2020 first week and ending in October 2020 end, course will be delivered on Zoom live webinars at
8:30 AM New York
1:30 PM London
5:00 PM New Delhi
8:30 PM Singapore
Size and Diversity
The class will have maximum 30 students from 3 to 4 different countries, may be more diverse depending upon registrations. Though most of the learners are students and freshly pass-out, people having experience in different fields who are trying to change fields are also joining.
If it essential and mandatory for you to schedule a consultation with me and have a one to one talk for 20 minutes before you become a student. So if you are considering to join this course, schedule a consultation with me using my calendar to discuss what are your goals, and how this course will benefit you.
Practice & Project Work
Around 30% to 40% of your learning will happen from my lectures. The remaining and true learning will happen when you will practice. To give you enough practice work there will be
Assignments
Weekly Practice Workbook Handouts
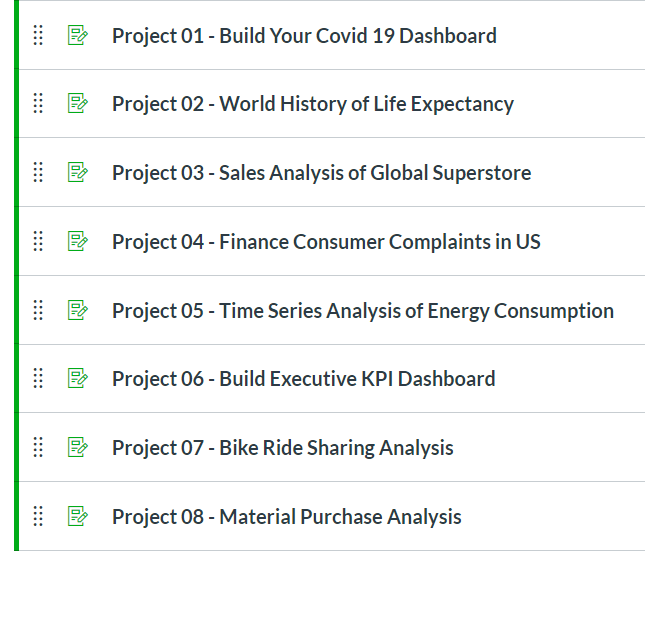
8 Weekly Projects
Heavy focus on MakeOverMonday
Practice Datasets Repository
Recorded Lecture Sessions
Lecture Presentations
8 Weekly Projects
Apply the learning into real world
Build your project portfolio
Gain Confidence
Share your work with world on Tableau Public and LinkedIn
Get feedback from #DataFam
Meet Your Teacher
Hello,
Nice to meet you. I am Ashish, a 29 year old guy based in Mumbai. I started my career back in 2009 when I was still 17 years old and being an Excel ninja was considered to be cool. I am an English Literature honors graduate from University of Delhi.
I have worked with various large consumer good companies and banks on either data analysis roles or as external consultants. For last 3 years, I have shifted my focus towards manufacturing domain.
In my last job, I was a senior analyst at The Boston Consulting Group. Currently, I have co-founded ScatterPie Analytics, and work as principal for data visualization practice area. My major day to day job role involves advising CXOs on modernizing their business intelligence solutions, building analytics road map for organizations, and mentoring our internal team to build better visualizations and BI solutions.
I value learning and hard work a lot. If you are someone who thinks can benefit from being my student for three months, please do not hesitate to reach out to me, I would love to talk to you and see what best can be done. Sometimes just having a casual talk with someone can help us a lot.
Best,
Ashish Singh

Seat Vacancy Update as on 26 July, 2020. Updated manually daily.
27 out of 30 seats filled. 3 available.
Frequently Asked Questions
WHO THE COURSE IS FOR? 👩💻
The course is aimed at people who want to get started into data analysis and have no or little experience with coding. The course uses mostly SQL and drag and drop based tools to teach professional data analysis skills.
WHAT SKILLS WILL BE TAUGHT? 💻
SQL, Tableau Desktop, Data Visualization, Exploratory Data Analysis, and Reporting. Enough to get you your first internship or job.
HOW CAN I JOIN? 💻
You will be enrolled only after your counselling appointment has been done and I think you are good fit to the course and will enable a good learning environment for your colleagues and yourself. If you are selected, you will be sent a payment page. Upon successful completion of the payment, you will be given access to the Canvas Classroom Platform of your cohort and can start learning.
WILL MACHINE LEARNING BE TAUGHT? 🤖
No, machine learning, Python or statistical data analysis will not be taught. This is not a data science course. This is exploratory data analysis and business intelligence course.
DO I NEED TO BE MATH EXPERT? 🔢
No, high school level math and a good common sense if sufficient to successfully complete the course, and apply the learnings into the real world.
HOW MUCH IS THE FEE? 💵
$300 including all taxes. Can be paid in two installments under some circumstances.
Special aid available for economically weak students and students from low income countries as classified by the World Bank.WHAT IS DURATION OF COURSE? 📅
You will learn 3 months with me. 2 lectures delivered every week. Two hours each. The course will total 24-30 lectures lasting 50-60 hours.
ARE TRIAL CLASSES AVAILABLE? ⚖️
No, but you can watch some of my talks which I have delivered publicly. You can book a 20 minute consultation with me before taking a decision to see if this course will be a good fit for you.
WHAT IS YOUR REFUND POLICY? 💲
100% refund no questions asked within 8 days of first lecture attended. Refund requests can be submitted via e-mail.
WILL I GET A CERTIFICATION OF COMPLETION? 📜
A certification of accomplishment will be provided upon completion of the course.